7 October 2026
How to estimate retail unit footprint from satellite imagery
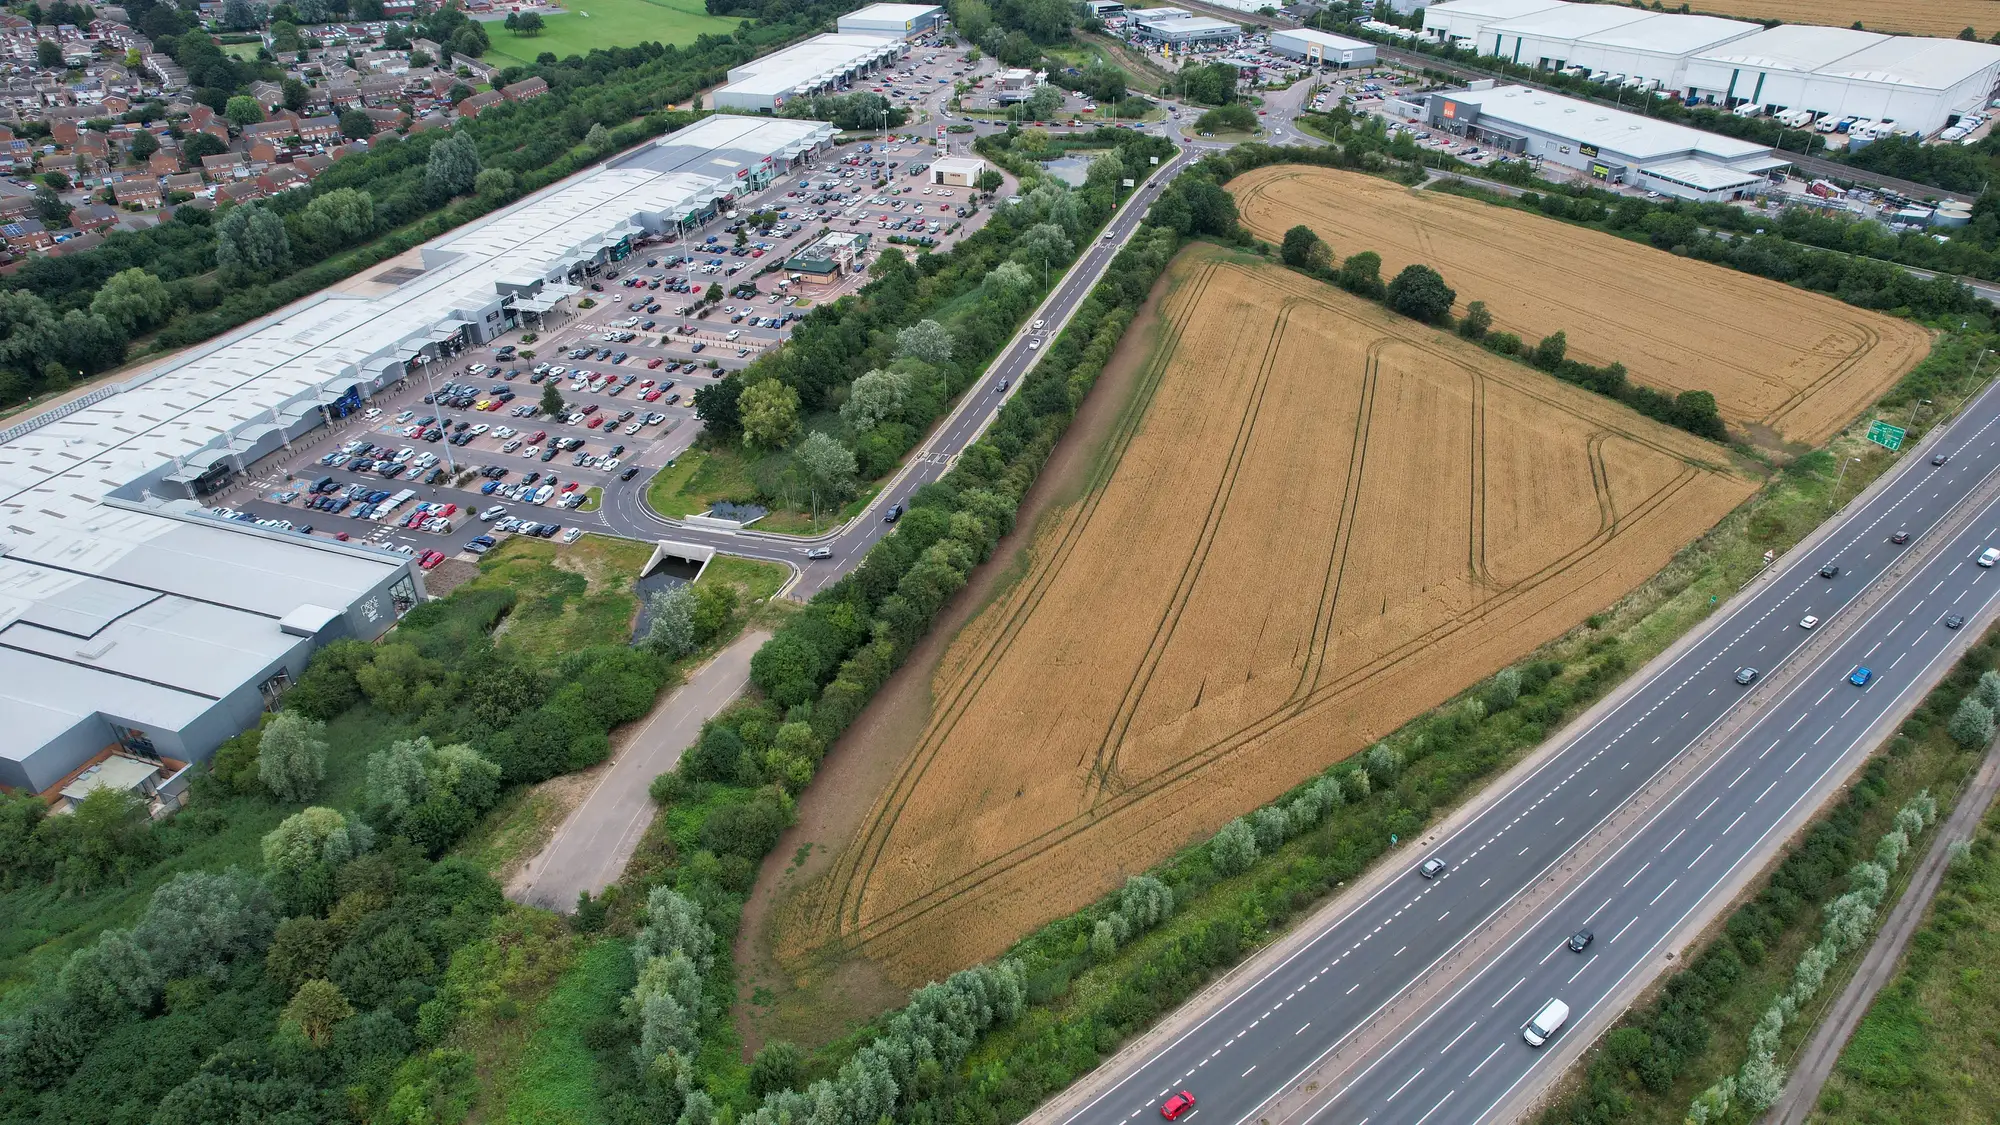
A competitor breaks ground on a new site, and the first question from your merchandising team isn't "is it open yet." It's "how big is it." Is this a 12,000 sq ft neighborhood format or a 45,000 sq ft anchor box. That number shapes what you assume about their assortment, their labor model, and whether they're testing a format or rolling out the flagship. You usually need an answer weeks before the planning permit shows up in a local paper, let alone before the chain puts out a release.
Satellite imagery gets you a reasonably tight footprint approximation, and for competitive tracking purposes that's almost always enough.
Start with a building you already know
The fastest way to calibrate is to pull up a store from the same chain, or a comparable chain, whose exact square footage you already have from a lease filing, a planning document, or a store locator that lists size. Measure that known building in the image first. Count how many pixels its length and width span. That gives you a pixels-per-foot ratio for that image's resolution, which you then apply to the unidentified building next door or across town.
This matters because satellite resolution varies by provider and by pass. High-res commercial imagery typically runs somewhere in the 0.5–2 meter ground sample distance range, meaning each pixel represents that much ground on a side. A rooftop that's 40 pixels wide at 1 m GSD is roughly 40 meters, about 131 feet, across. Multiply length by width and you've got a rough footprint, not a leasable square footage number, since rooftop area and leasable area aren't the same thing once you account for loading docks, mechanical screening, and exterior walls.
Count the rooftop, then sanity-check with the lot
Rooftop measurement alone can mislead you, especially with big-box formats that have garden centers, vestibules, or attached pickup canopies that read as one continuous roofline but aren't all sales floor. Two checks help here.
First, look at the building's shape against known prototypes. Most national chains build to a handful of standard footprints: a discount grocer runs three or four prototype sizes, a home improvement chain typically two. If your measured rectangle lands close to one of those, the pixel count is confirming which prototype got built, not revealing a new one.
Second, cross-check against the parking lot. Retail parking ratios stay consistent within a format class, running around 4 to 5 spaces per 1,000 sq ft for grocery and general merchandise. Count the striped spaces in the lot, do the math, and see if it lines up with your rooftop estimate. When the two methods agree within a reasonable margin, the number holds up. When they don't, something's off: the lot might be shared with an outparcel, or part of the roofline covers a loading area with no sales floor beneath it.
Where this approach runs into trouble
Shadows are the main source of error. A building photographed with a long shadow angle can look shorter or longer than it is if you're eyeballing the edge instead of using the shadow geometry to correct for it. Mixed-use buildings are another problem: if the retail unit sits below apartments or offices, the rooftop footprint tells you nothing about the retail floor plate underneath. And renovations that extend a building's footprint without changing its visible roofline, like a basement expansion, won't show up at all from directly overhead.
None of this makes the method useless. It makes it a first estimate you refine with other signal, the same way you'd treat a drive-by observation or a satellite image a broker sent you. For a single store, that's a reasonable amount of manual work. For tracking a whole competitor estate quarter over quarter, across dozens of markets, doing this by hand for every new permit and extension stops being realistic fairly quickly.
That's the gap Competitor Expansion is built to close: a quarterly pass over a named competitor's store estate that flags new builds, extensions, and closures with location and approximate footprint already worked out, so you're not measuring rooftops one at a time. If you're tracking a competitor's build-out across more than a handful of sites, it's worth seeing what a quarter of change-log data looks like.